22 Statistical Inference
22.1 Data Collection as a Probability
- Suppose data are collected in such a way that it is randomly observed according to a probability distribution
- If that probability distribution can be parameterized, then it is possible that the parameters describe key characteristics of the population of interest
- Statistical inference reverse engineers this process to estimate the unknown values of the parameters and express a measure of uncertainty about these estimates
22.2 Example: Simple Random Sample
Individuals are uniformly and independently randomly sampled from a population.
The measurements taken on these individuals are then modeled as random variables, specifically random realizations from the complete population of values.
Simple random samples form the basis of modern surveys.
22.3 Example: Randomized Controlled Trial
Individuals under study are randomly assigned to one of two or more available treatments.
This induces randomization directly into the study and breaks the relationship between the treatments and other variables that may be influencing the response of interest.
This is the gold standard study design in clinical trials to assess the evidence that a new drug works on a given disease.
22.4 Parameters and Statistics
- A parameter is a number that describes a population
- A parameter is often a fixed number
- We usually do not know its value
- A statistic is a number calculated from a sample of data
- A statistic is used to estimate a parameter
22.5 Sampling Distribution
The sampling distribution of a statistic is the probability disribution of the statistic under repeated realizations of the data from the assumed data generating probability distribution.
The sampling distribution is how we connect an observed statistic to the population.
22.6 Central Dogma of Inference
22.7 Example: Fair Coin?
Suppose I claim that a specific coin is fair, i.e., that it lands on heads or tails with equal probability.
I flip it 20 times and it lands on heads 16 times.
- My data is \(x=16\) heads out of \(n=20\) flips.
- My data generation model is \(X \sim \mbox{Binomial}(20, p)\).
- I form the statistic \(\hat{p} = 16/20\) as an estimate of \(p\).
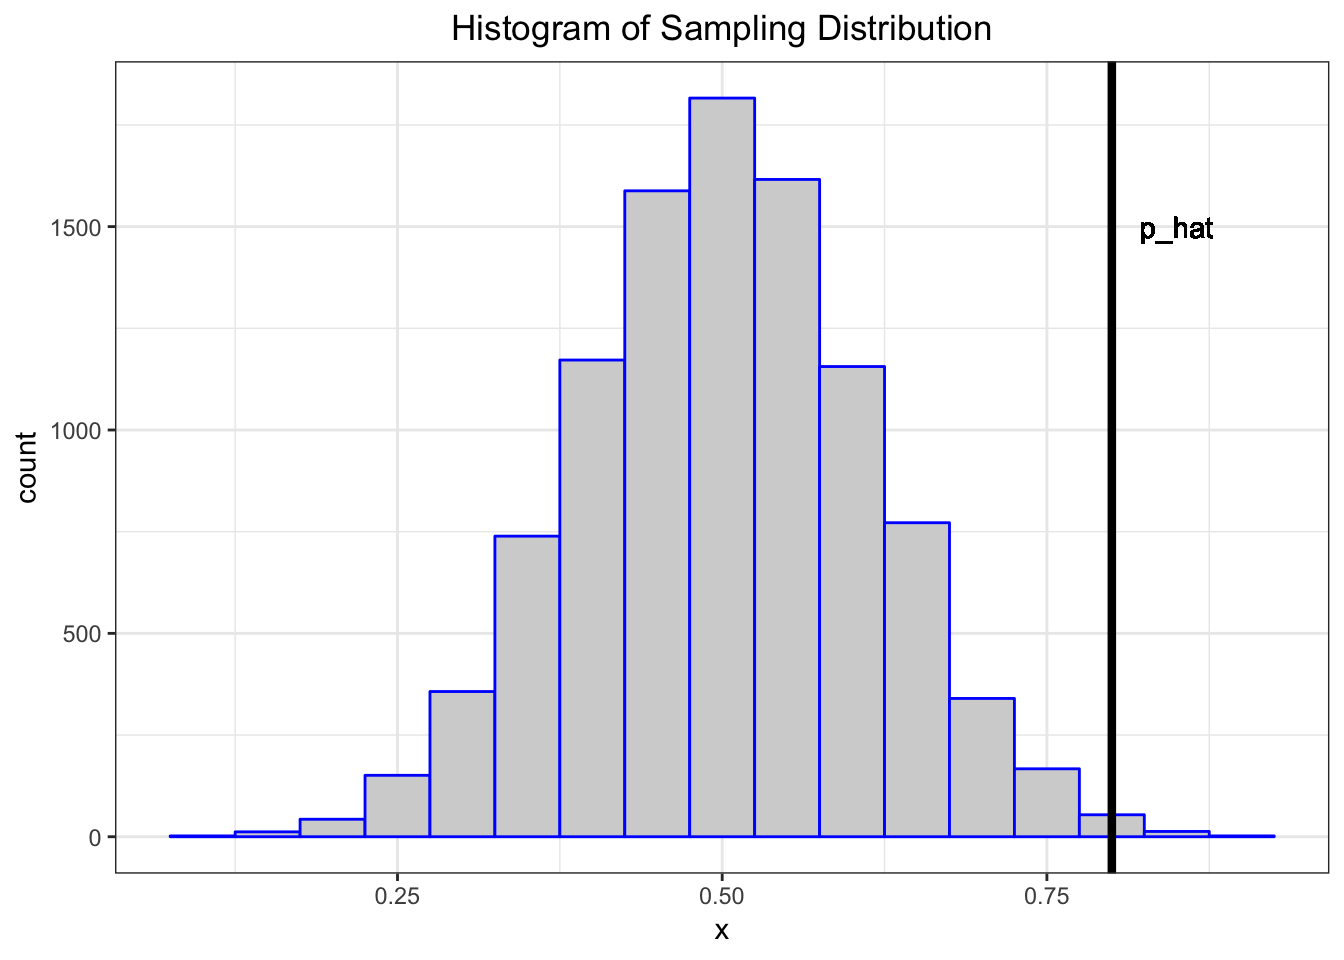
Let’s simulate 10,000 times what my estimate would look like if \(p=0.5\) and I repeated the 20 coin flips over and over.
> x <- replicate(n=1e4, expr=rbinom(1, size=20, prob=0.5))
> sim_p_hat <- x/20
> my_p_hat <- 16/20
What can I do with this information?